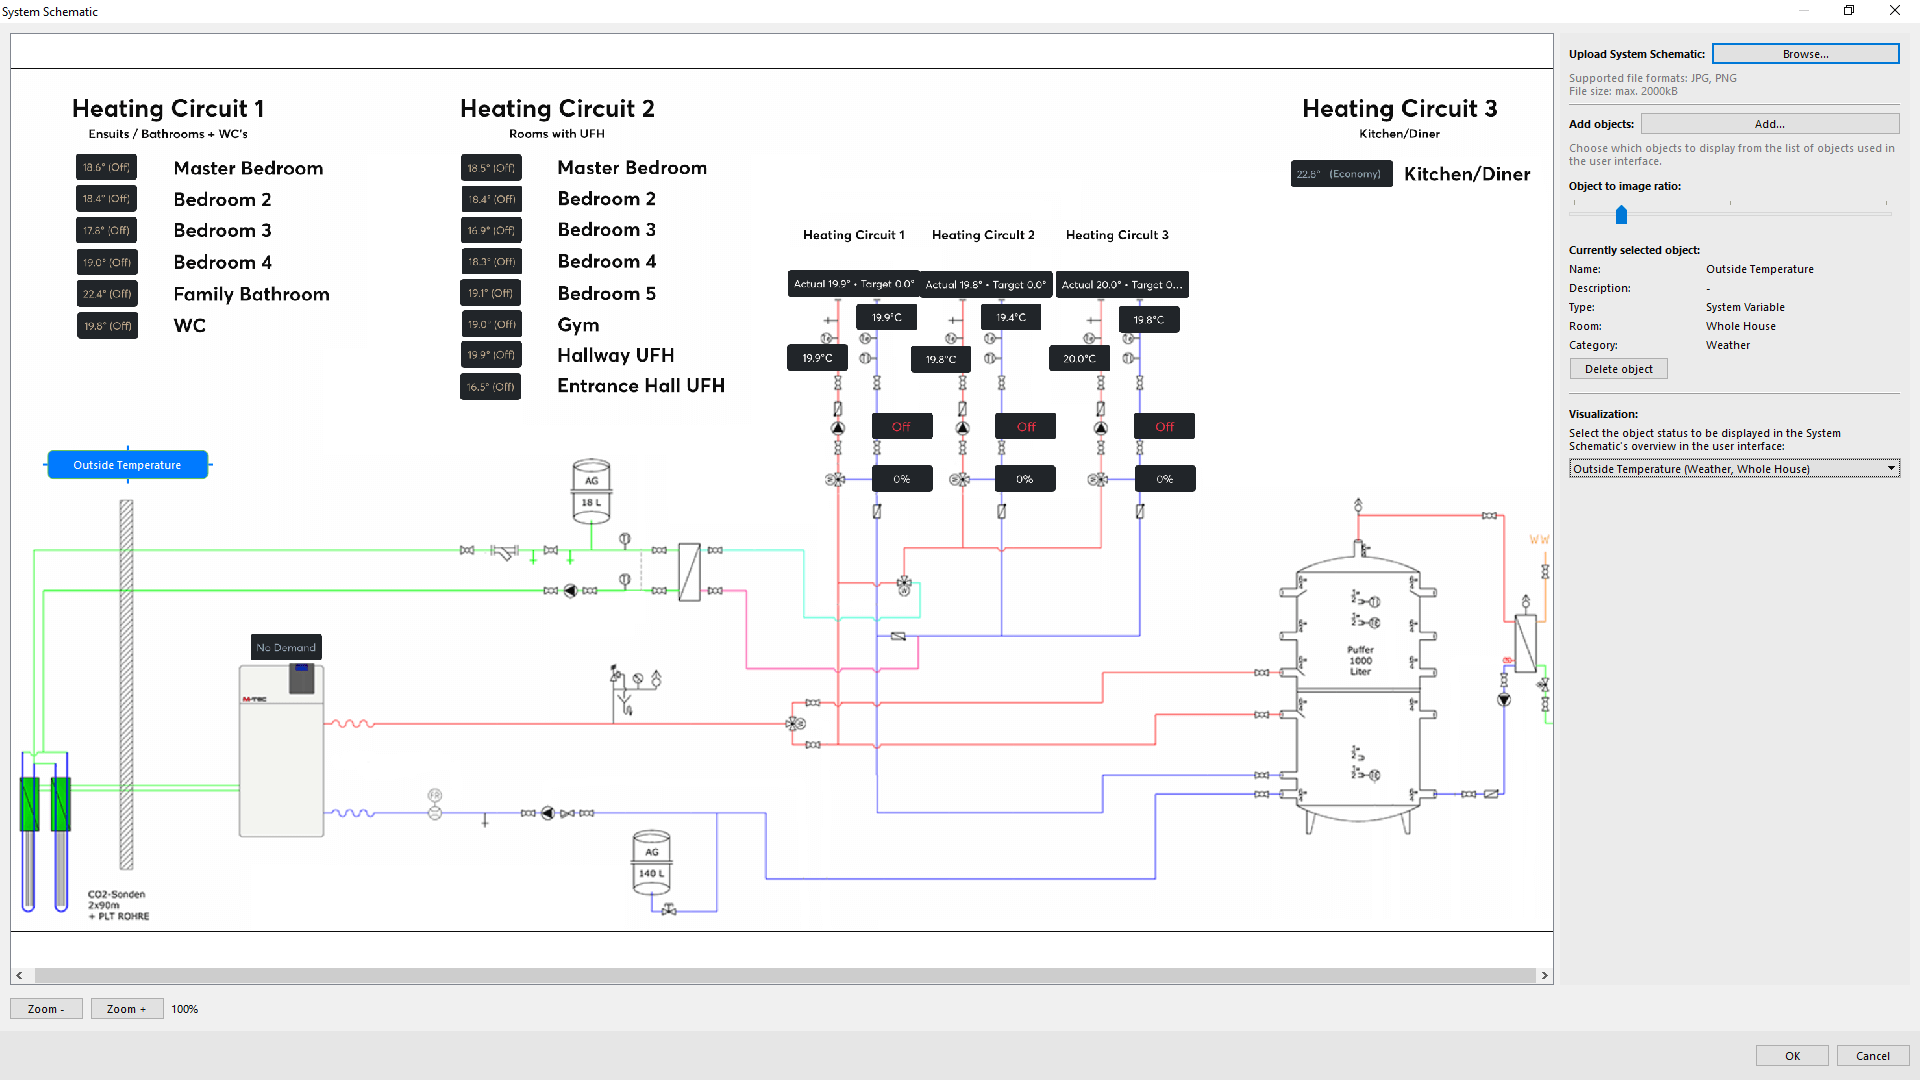
Brief: I want a schematic diagram to visually represent the status of my building.
In a modern, intelligent building there’s a lot happening in the background to ensure that everything functions smoothly. In this Use Case, we’ll focus on a heating system – however, schematic diagrams can be used to visualise a wide range of things. In this heating system, there are several heating circuits and mixing valves being controlled by the Miniserver. Multiple values are recorded through multiple sensors – such as the flow and return temperatures.
In this Use Case, we’ll show you how to upload a schematic diagram to visually represent this system – providing all of the crucial information at a glance.
Solution: Using Loxone to create schematic diagrams for buildings.
A schematic diagram will help create a simple visual representation of a complex system. To achieve this with Loxone we’ll use the “System Schematic” Function Block. Simply upload an image of the system, then Function Blocks can be overlaid onto that image to give a clear overview. In our example, we’ve got a heating system with heating circuits. The pumps, the manifolds, the mixing valves, as well as the flow and return temperatures are displayed graphically.
The “System Schematic” Function Block is only available in Version 11 of Loxone Config.
Configuration:
Related Video Tutorial
 |
Focus Series: System Schematic Take a look at the new System Schematic Function Block within Loxone Config which allows the graphical visualisation of systems, floor plans and more in the Loxone App. View Video >> |
Why you and your customer should consider implementing schematic diagrams?
By visually displaying multiple Function Blocks in one location, you can create a holistic overview of complex systems and logic. A schematics diagram would be perfect for helping a facilities manager, for example.
