In addition, data communication can be analysed via interfaces to devices.
CONTENT:
Activate and set up monitor
Taskmonitor
Monitor
Examples
Troubleshooting
Activate and set up monitor
To activate the monitor, first click the Diagnostics tab in Loxone Config and then click Debug Information.
In the next window, set the target, detail level and duration of the monitor data:
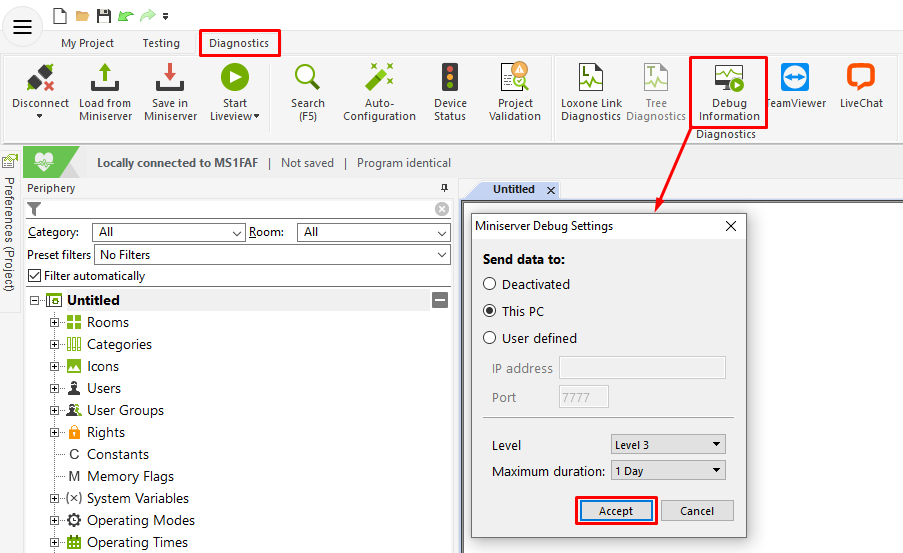
Send data to: specifies the destination for the sent data.
Normally this is the PC where Loxone Config is connected to the Miniserver.
The Loxone Debug Information Monitor only works within the local network (LAN). To send data to an external address, port 7777 must be open on the receiving device.
Level: Sets the level of detail:
Level 1: provides only some basic or important information.
Level 2: provides more detailed information such as data sent through interfaces.
Level 3: provides all available information, for advanced users.
Maximum duration: determines how long the monitor data is sent to the destination.
To deactivate, reopen the window and select “Deactivated” under Send data to.
Finally, click on Accept, which opens the monitor window:
Taskmonitor
The Task Monitor is located in the top half of the window.
It shows running services and connections, and provides information and statistics
about the Miniserver’s CPU, memory and interfaces usage:
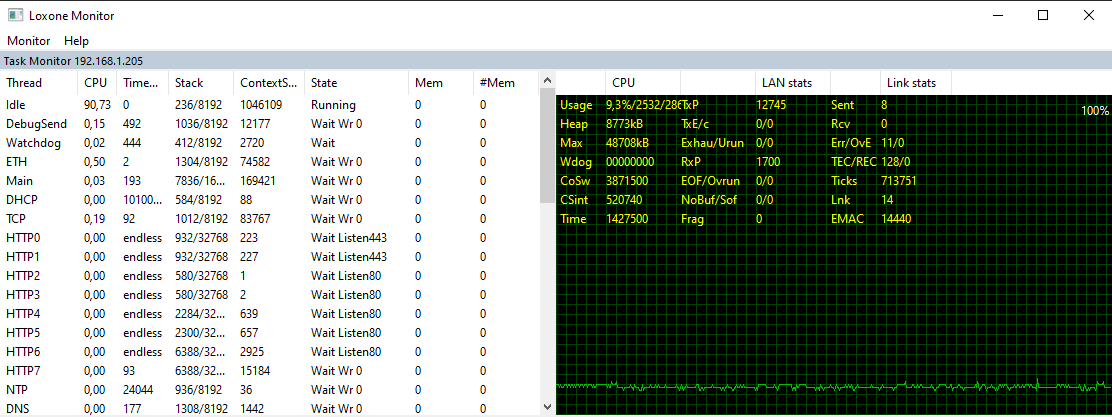
Here is a brief explanation of some of the terms:
| Idle: Inactive processes Watchdog: Triggers a restart after errors HTTPx: Connections for visualisation – several per connection |
Usage: Current CPU utilisation Heap: Currently occupied working memory Max: Maximum available working memory Wdog: Triggers a restart after errors |
Monitor
The Monitor is located in the bottom half of the window.
This is where a timestamped line is created for each piece of information sent.
The data is displayed continuously and can also be saved on the PC.
In the background, the data is also automatically stored in the following folder:
C:\Users\Name\Documents\Loxone\Loxone Config\Monitor
A new file is created every 50,000 lines.
Features:

1. Open saved monitor file
2. Save the monitor file
3. Clear monitor window (clear input)
4. Turn Auto Scroll on/off
5. Display time from PC on/off
6. Allow updates if a monitor file is already open
7. Select which Miniserver is to be analysed
8. Enter filters (e.g. CAN)
9. Search for a value
Data:
Column 1: consecutive number of the line from 0 to 50 000
Column 2: Shows the IP of the sender (Miniserver).
Column 3: shows the timestamp per item
Column 4: contains the protocol type
Column 5: contains the report information
To reach your goal faster, you should also set filters.
For example, if you want to filter information from a particular Extension, enter its serial number as the filter.
Examples
STATE CHANGES OF INPUTS/OUTPUTS OF AN EXTENSION
BUS value of “Extension serial number”
![]()
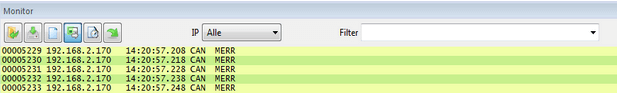
ERROR ON LOXONE LINK
CAN MERR:
Check the wiring and termination of the Loxone Link. (2-pole blue connector).
![]()
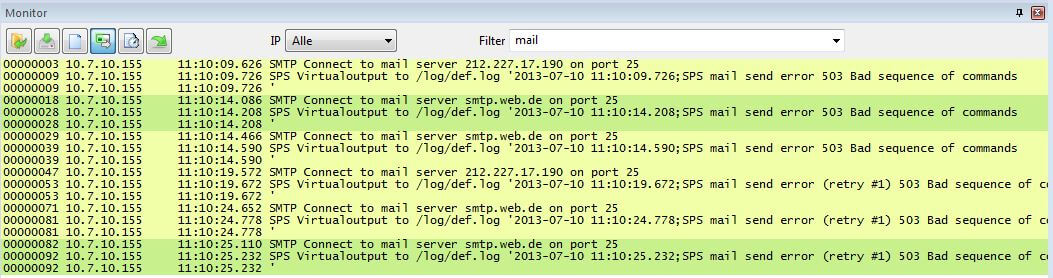
PROBLEM WITH SENDING MAIL
Possibly the mail server uses SSL (not supported by Miniserver), an incorrect mail server was specified, or the user credentials are invalid.
A filter has been set here: “mail”.
WEBSERVICE REQUEST
![]()
PROBLEM WITH WEATHER SERVICE
UBIMET error:
Presumably, you have not yet activated the weather services.
A filter was used here: “ubimet”
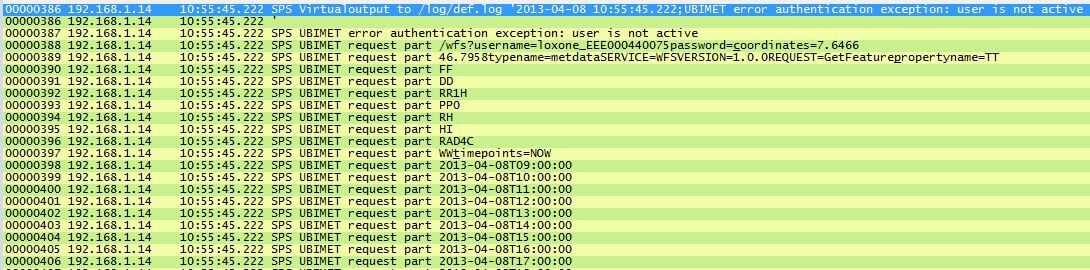
LOG FILE IS WRITTEN
SPS Virtualoutput to /log/def.log:
An event was written to the file def.log.
![]()
ERROR WHILE WRITING TO SD CARD
SDC Card locked:
SD card is full or access denied.
![]()
WRITE ACCESS TO SD CARD
FS Transaction done:
Means “File System Transaction”, i.e. something is written to the SD card.
Moreover, writing time is indicated. The times in this example are a good guideline for a fast write time.
SYSTEM START
The system starts normally but an error has occurred at the end, forcing the system to reboot.
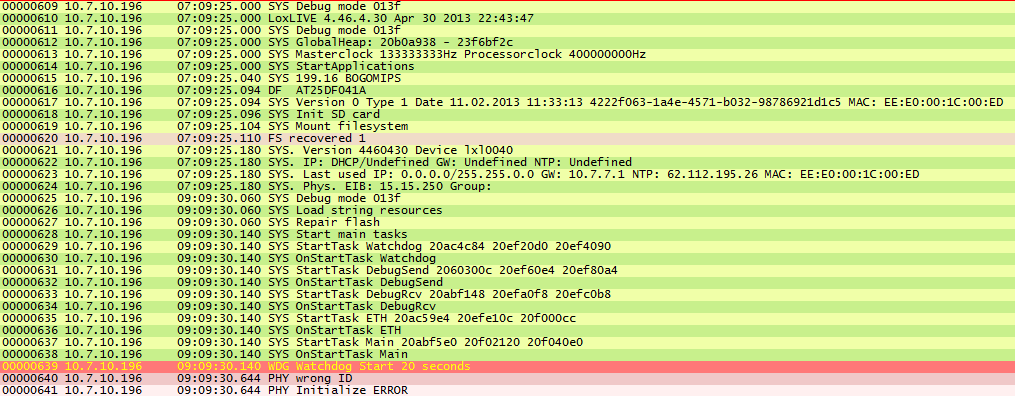
WATCHDOG PROBLEM
If a system error occurs, the watchdog starts running. The system now has 20 seconds to correct the error. If the problem persists beyond 20 seconds, a reboot is performed.
![]()
![]()
Troubleshooting
Can’t receive monitor data?
The network connection on the PC may be set as public, blocking monitor data.
If the network connection is set as home or work network, there should be no problems.
If the data is still not being received, the login settings can be reset with the following command: